01
Fragmented data
Channel data, ATU (Awareness, Trial and Usage) tracking, NPS studies and competitive intelligence often sit separately, making a coherent view impossible.

Navigator365 Benchmark 4D
Navigator365 Benchmark 4D is a brand-level competitive diagnostic that connects omnichannel engagement, customer experience, brand attributes and adoption dynamics against the named competitors that matter. More than 40 pharma and life sciences companies have used Benchmark data, including 19 of the world’s 20 largest pharma companies. Through September 2026, more than 26,000 HCPs have reported on over 400 brands from 154 companies, across 70 indications, 33 specialties and 30 countries.
The challenge
01
Channel data, ATU (Awareness, Trial and Usage) tracking, NPS studies and competitive intelligence often sit separately, making a coherent view impossible.
02
Company or industry averages hide the variance that matters for a specific brand in a specific market.
03
Many benchmarks compare against generic analogs, not the named brands you actually compete with every day.
04
Data often stops at reporting and does not clearly guide what to start, stop or shift in the real world.
Many teams can see how channels perform, but struggle to understand whether those activities are changing customer experience, brand perception or commercial outcomes.
Navigator365 Benchmark 4D connects the full chain from engagement to adoption. It helps teams understand what is happening, why it is happening and where to act next.
What Benchmark is
Since 2021, Navigator365™ Benchmark – rooted in more than a decade of innovative omnichannel HCP insight from our Navigator365 Core offering – has built one of the largest outside-in datasets on how HCPs perceive pharma brands versus their direct competitors. Navigator365 Benchmark 4D is built to support brand planning, omnichannel optimisation and evidence-based prioritisation.
01
Benchmarks are built around specific brands and named competitors, not generic category averages.
02
Understand where you stand versus the competitors that matter in the real market context.
03
Connect omnichannel engagement, customer experience, brand attributes and adoption outcomes.
04
Move from reporting to clear commercial decisions about where to start, stop or shift.
The diagnostic model
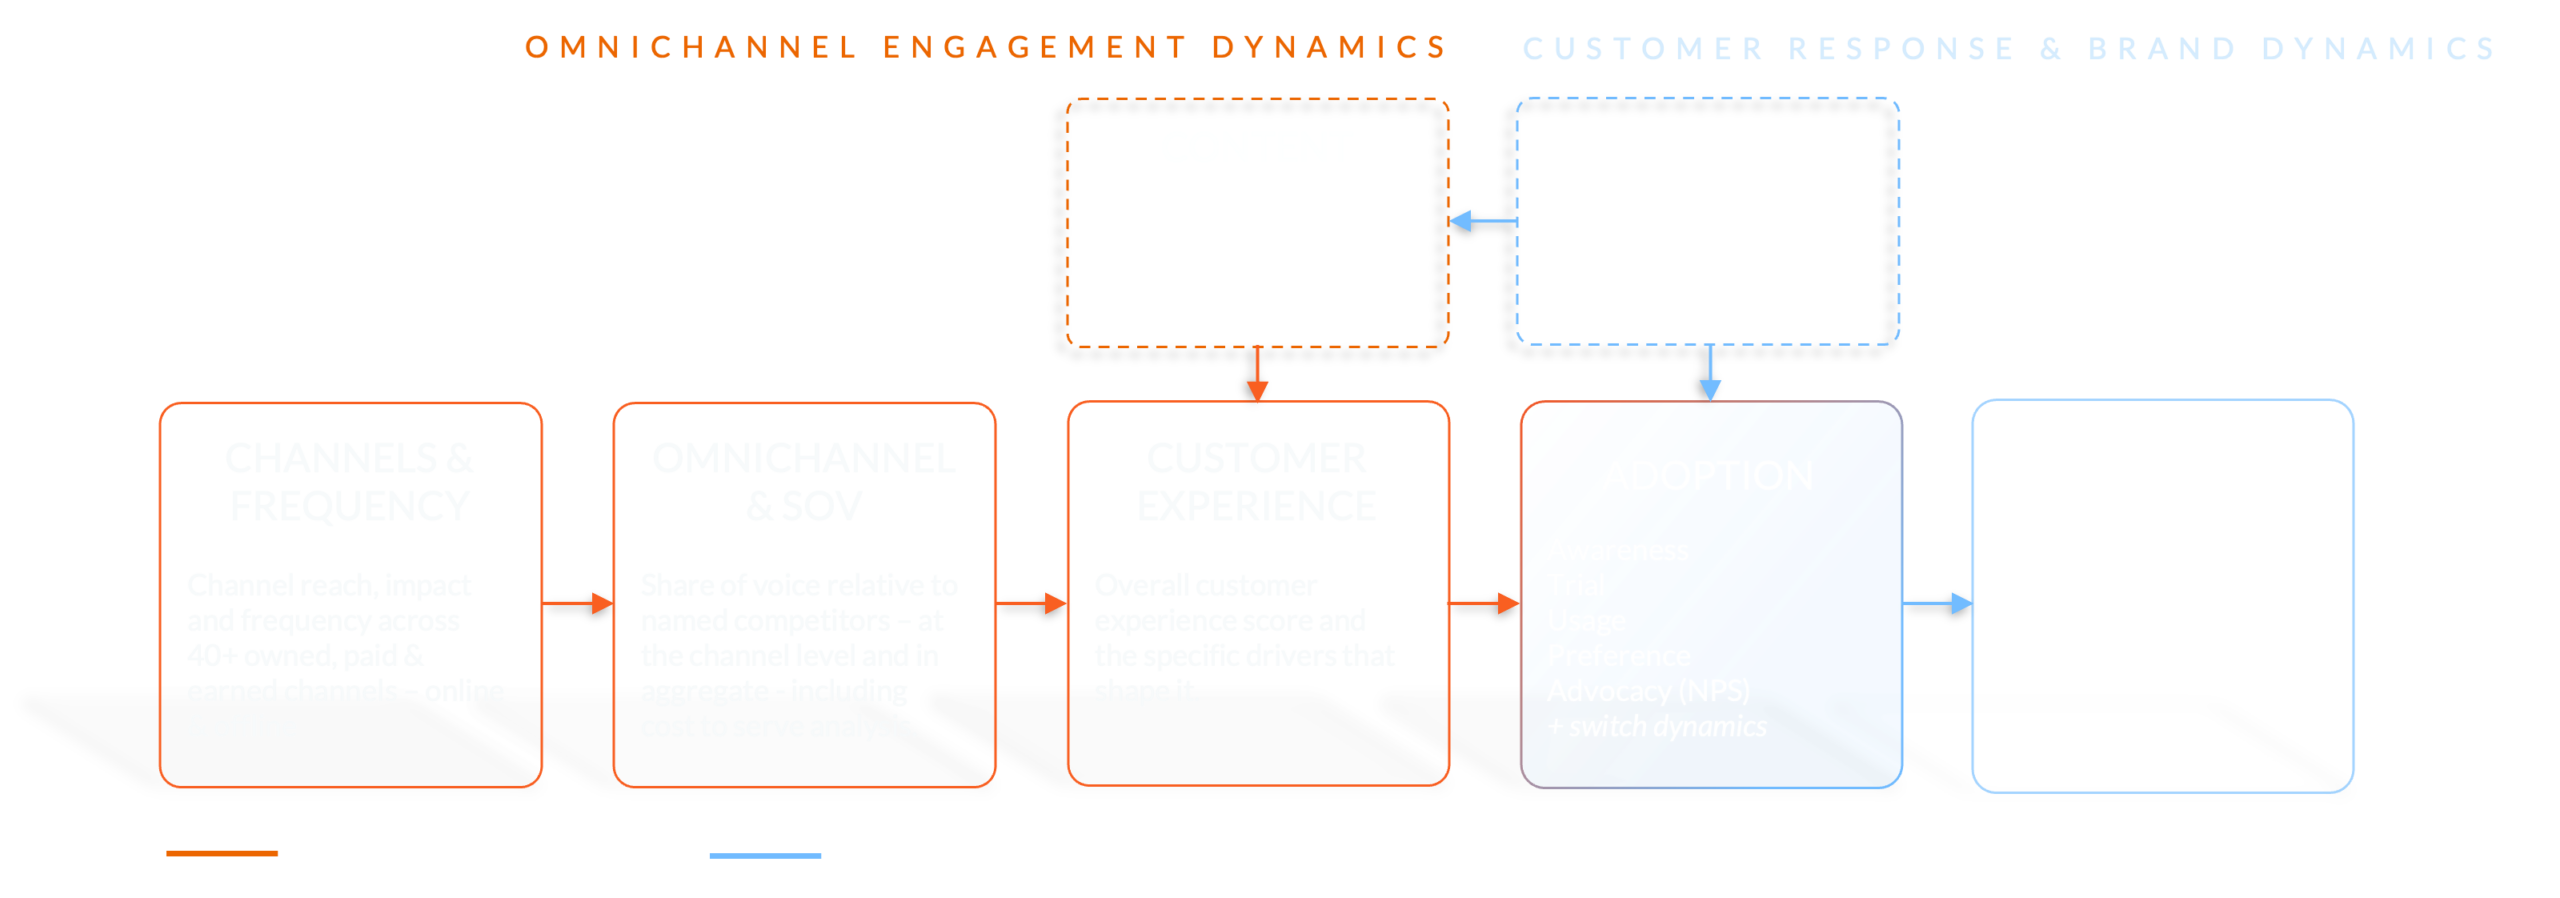
Each Benchmark paints a comprehensive outside-in picture of the competitive and customer landscape where it matters: the relevant competitive set for your brand. The diagnostic framework connects “input” (omnichannel engagement) with “output” (brand response): channels, content, share of voice and CX on the input side; brand attributes, adoption, Rx breadth, prescribing intent, NPS and switching on the output side.
From data to decisions
With the next-generation Navigator365 Benchmark 4D, we go squarely beyond the industry-standard Data level. Our AI-powered framework delivers an evidence-based Diagnosis and a range of possible Decisions (start/stop/shift/...). Finally, datasets can be cut by any segment with a robust sample to show where groups behave differently (the fourth D: Deaveraged). Across Health runs these analyses for you today; a full self-service conversational AI platform launches in early 2027.
What is happening in the market: omnichannel reach, share of voice and engagement dynamics across relevant channels.
Why performance is what it is: connecting engagement, customer experience, brand attributes and adoption drivers.
How to improve performance: clear start, stop or shift recommendations for commercial teams.
AI-driven subanalysis to uncover hidden insights beneath aggregate data by segment, region or competitor.
Download fact sheet
Use cases
Identify which channels drive impact and where resource reallocation would shift outcomes.
Assess how your brand attributes compare against key competitors in the eyes of HCPs.
Understand how content quality and channel presence affect CX scores and NPS.
Benchmark against category leaders before or at launch to calibrate ambition and strategy.
Determine whether to defend territory or shift investment to gain share from named rivals.
Measure the performance impact of interventions through follow-up Tracker Waves over time.
Evidence
0.84
between omnichannel performance and CX scores in a dermatology benchmark analysis.
85% vs 62%
for brands leading on both rep and non-rep channels, versus brands leading on rep-only channels.
Up to 60%
driven by customer experience factors in US specialty studies - not just product attributes.
-38 → channel leader
achieved for a brand after a targeted omnichannel and content intervention informed by Benchmark data.
8 in 10
rate (much) better than the competition (Maturometer™ 2025).
Ready to understand what drives your brand performance?