
Blog 2 of 7 — From Inside-Out to Outside-In: A seven-part thought leadership series on pharma budget optimization · Navigator365™ Benchmark
In the previous blog we argued that the problem often isn’t the size of your budget, but how it’s allocated. This blog is about the most underestimated cause of poor allocation.
The average.
Ask for the ROI of your detailing, your omnichannel efforts, your congresses, and you get back one number per channel. Those numbers feel like facts. They are averages — and an average is precisely the information you throw away the moment you calculate it. There is an old saying that you can drown in a river that is on average one metre deep.
“Averages are so old normal.” – Peter Hinssen
What the average hides
De-averaging. The term isn’t ours. McKinsey has been telling executives to “de-average” (break aggregate data into parts) markets for decades [1]. Their illustration is hard to argue with: telecommunications services grew at 1.6% a year over the period they studied — a textbook mature industry — while inside it the fastest-growing company was adding 21% a year and the slowest shrinking by 9% [2]. One figure, a thirty-point spread beneath it.
Pharma channel budgets are built on exactly this kind of figure. “Works moderately” can mean a little effect everywhere, or a strong effect in half your audience and nothing in the other half. Those two worlds call for opposite decisions, and the average cannot tell you which one you are in.
A Navigator365 Benchmark study of the UK osteoporosis market makes this crystal clear. Two brands, 75 respondents (mixed rheumatologists and geriatricians), one question (NPS): on a scale of 0 to 10, how likely are you to recommend this brand to a colleague? Pooled, the answer is dull. Split by specialty, it inverts.
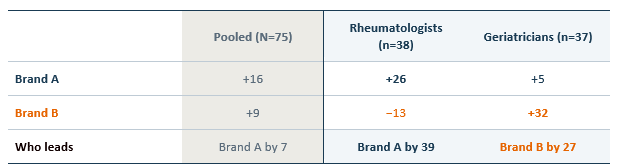
Net Promoter Score by specialty; the shaded column is the pooled average. Navigator365™ Cx Benchmark, osteoporosis, United Kingdom, Q4 2025 [3].
Steer on +16 versus +9 and you would defend a lead you don’t hold in half the market — and miss a deficit you do. For a budget, that is not a nuance. The pooled number argues for holding course. The split argues for moving money — out of the specialty where the brand already leads by 39 points, into the one where a competitor owns the relationship.
Specialty is only where we happened to start. The same dataset supports cuts by patient pool, by practice size and practice type, by phase of the lifecycle, by how recently a physician has been reached by a rep or an MSL, by which brands they already prescribe — and by NPS itself, used as a lens on every other metric rather than as the thing being measured. Any dimension is a legitimate starting point.
Averages should never be the unit of budget decisions. Segments should
So the habit is simple. Every time you see an average, ask what spread is hiding behind it.
- Behind “detailing works” → which physicians respond strongly, which not at all?
- Behind “email has low impact” → in which segment, in which phase, with which message?
- Behind “our market share is stable” → which sub-markets are growing while others drain?
This is where Navigator365™ Benchmark does something internal data or most market research cannot. It offers a full view of the diagnostic chain: from leading engagement inputs (which channels reached a physician, how often, with what content, at what Cx quality) to the leading outputs they are meant to move: awareness, trial and usage, brand attributes, Rx intent, NPS. Linking the two at segment level, against competitors, is what the new Navigator365™ Benchmark was built to do.
From insight to lever
Deaveraging is also a budget lever. Every euro you move from a segment where it does nothing to one where it sparks raises your return without spending a cent more. That is the mechanism behind the +51% scripts and +80% profit from the previous blog: not a bigger budget, but a budget that stops averaging.
In the next blog we apply this lens to the allocation question of the moment: the mix between digital and field force. The answer to “digital or rep?” is once again an average you have to decompose.
The average is comfortable. It’s just no basis on which to build a budget.
It’s no accident that deaveraging is the running lens of the Navigator365™ Benchmark 4D model — Data · Diagnosis · Decision – Deaveraging. The fourth D isn’t a fourth step; it’s the lens you apply at each of the other three. Before this season’s numbers get locked in, find out what your averages are hiding — talk to an Across expert about deaveraging your plan.
References:
- 1. Baghai, M., Smit, S. & Viguerie, P., The Granularity of Growth, John Wiley & Sons, 2008.
- 2. “The ten rules of growth”, McKinsey & Company, 2022.
- 3. Navigator365™ Cx Benchmark, osteoporosis, UK, Q4 2025 (N=75); specialty split from panel source, n=38 / n=37.