
When a brand performs differently across key markets, commercial teams often face a critical question: what’s really driving the difference?
Looking beyond sales data
That was exactly the case for a leading dermatology brand active in key European countries. Over a 12-month period, market share in Spain doubled from 7% to 14%. In contrast, Germany saw a modest increase from 6% to 8%. The brand team turned to Navigator365 Benchmark to investigate whether customer experience (CX) and omnichannel engagement (OC) strategies were influencing these trends.
Using Navigator365 Benchmark, we examined how the brand was performing versus its key competitors across 32 commercial channels in both countries – from face-to-face interactions to digital touchpoints. The benchmark enabled us to go deeper than just activity volume; it measured how HCPs perceived the brand’s engagement, including the effectiveness of its content.
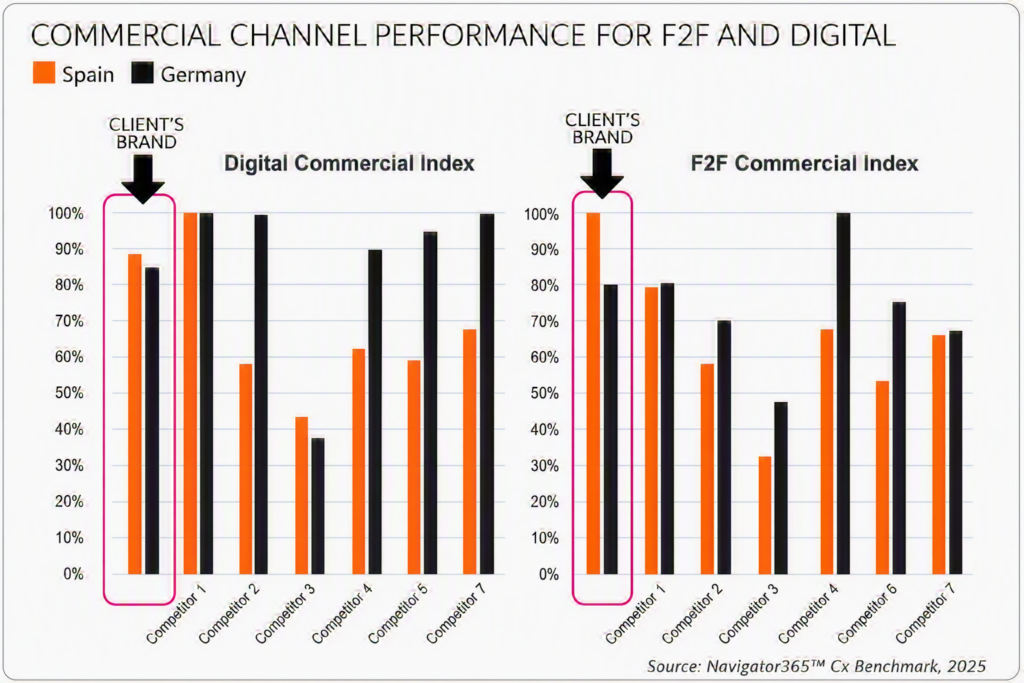
The F2F commercial index is a brand’s performance score for F2F rep/KAM visit, indexed to the leading score. The digital commercial index is a brand’s average score across top three digital commercial channels (based on reach and impact), indexed to the leading average score.
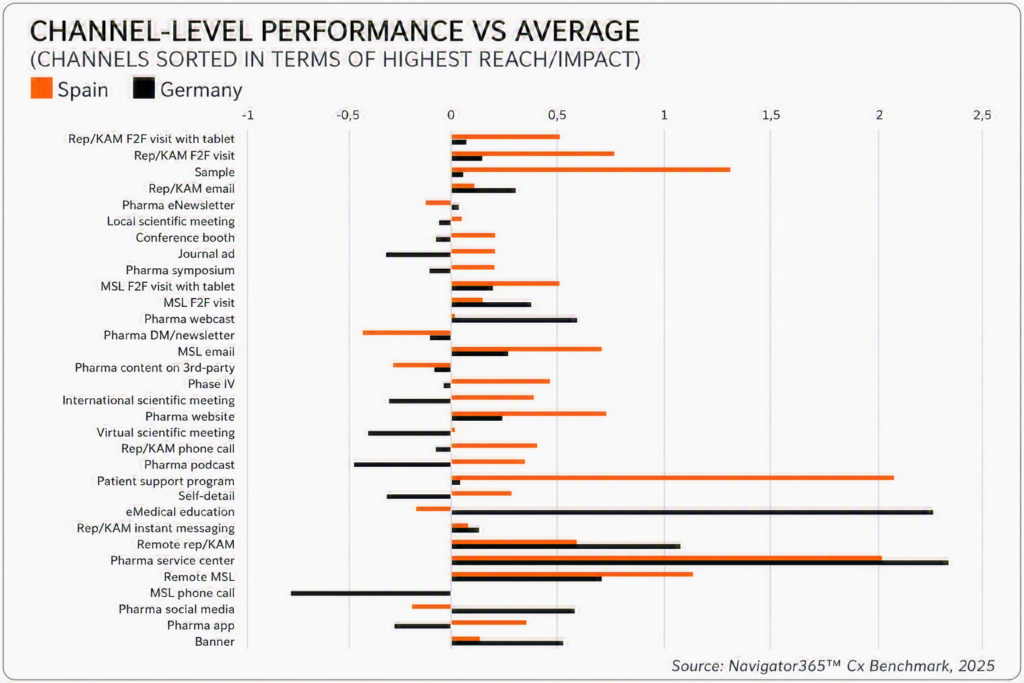
The performance score per channel for a brand is shown here as the percentage difference from the average performance score for the channel across all brands in a market. The channels are ranked by importance (reach, impact).
In Spain, the brand stood out as a leader in both Net Promoter Score (NPS) and CX performance. It consistently ranked above average across numerous touchpoints and scored highly on the most important HCP-defined CX drivers. In Germany, however, the story was different. The brand lagged behind major competitors on CX fundamentals and was less visible across the promotional mix. It achieved above-average CX scores on fewer channels, and HCPs rated it lower on both engagement frequency and perceived channel breadth.
Connecting OC and CX performance to market share
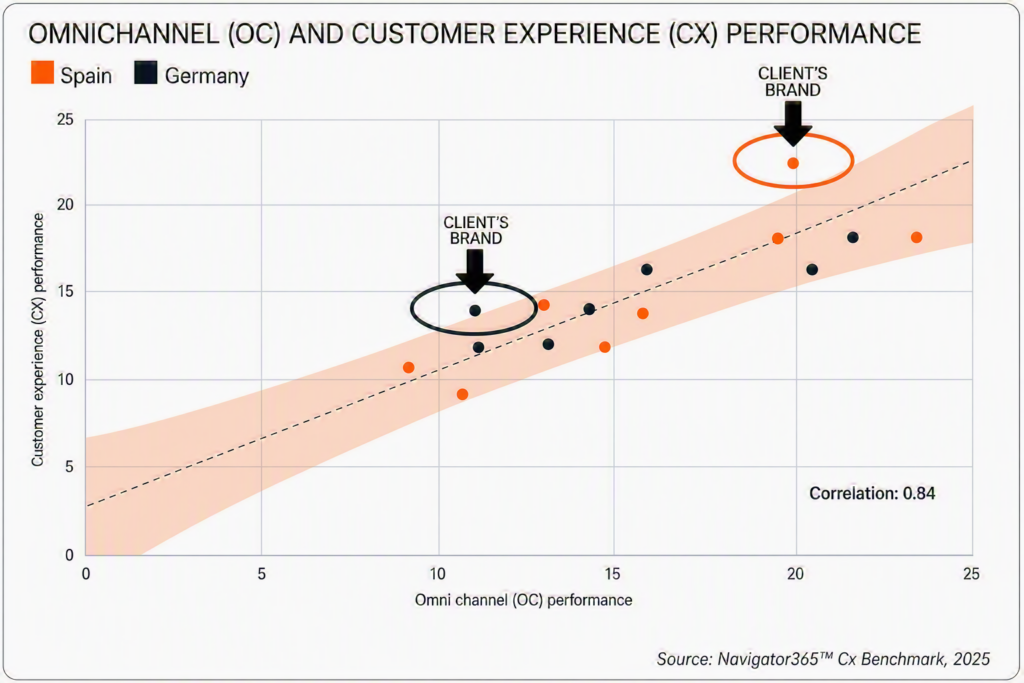
Omnichannel performance is a score from 0–100 expressing to what extent HCPs experience a seamless and integrated experience across multiple channels for each brand. Scores of all brands add up to 100. Customer experience performance is a score from 0–100 expressing performance of a brand vs direct competition, based on ratings of key CX drivers by HCPs, weighed by the importance of each CX driver.
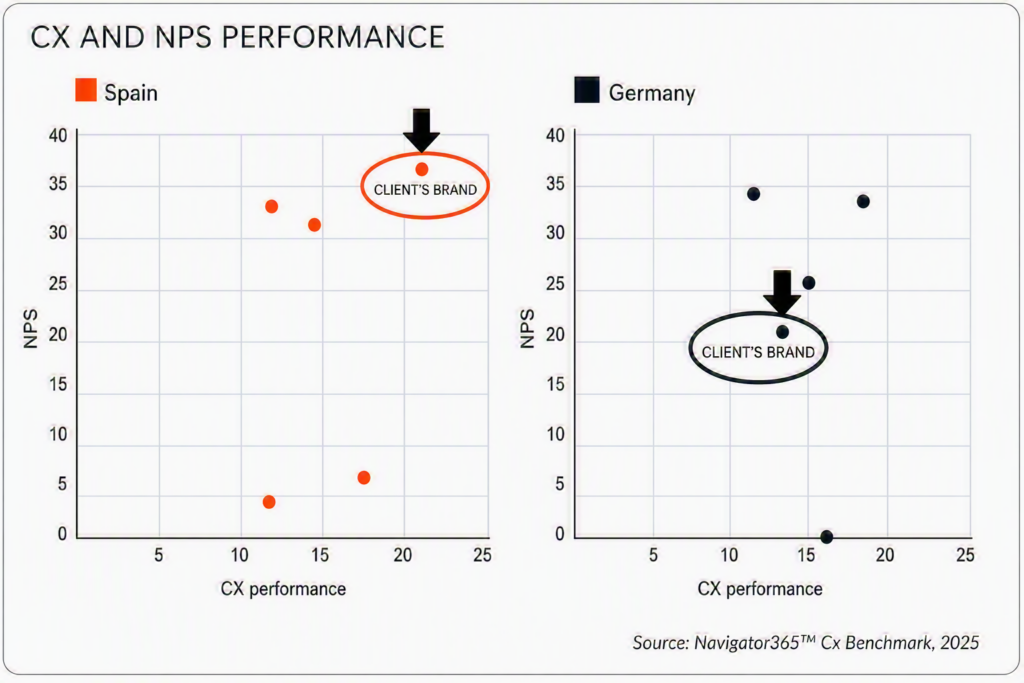
NPS is based on HCP’s answers to the question “How likely are you to recommend each of the following companies to a colleague?” The NPS is calculated by subtracting the percentage of detractors from the percentage of promoters. This means the highest possible NPS would be 100 (if all respondents were promoters) and the lowest -100 (all detractors) – an NPS above 0 means you have more promoters than detractors and is therefore considered a good outcome.
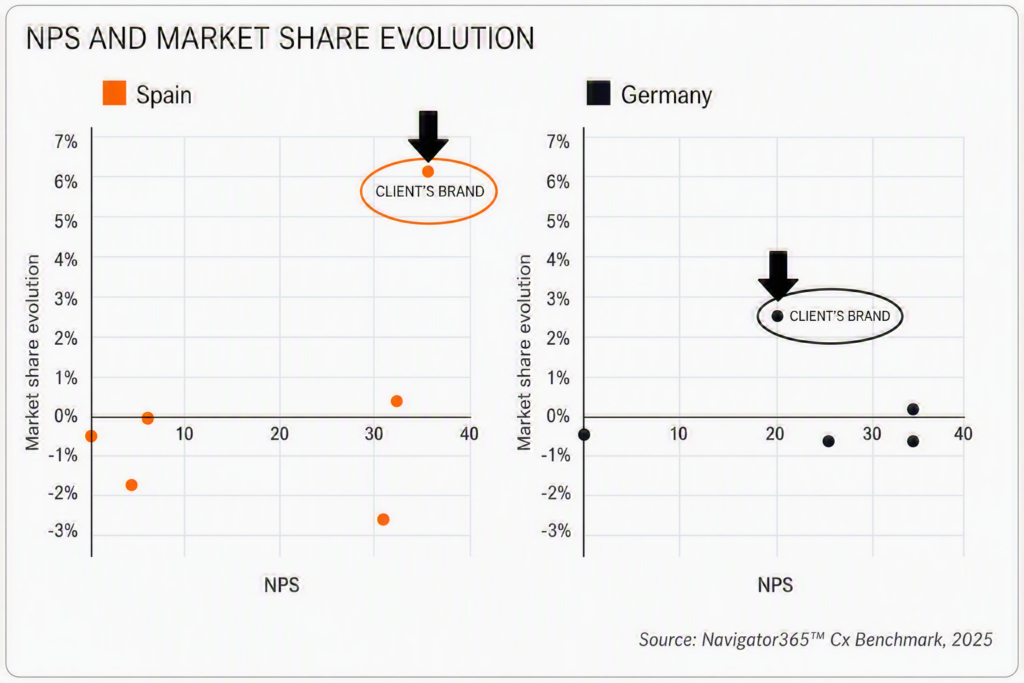
Market share in terms of ETP (patients). 3 months rolling average.
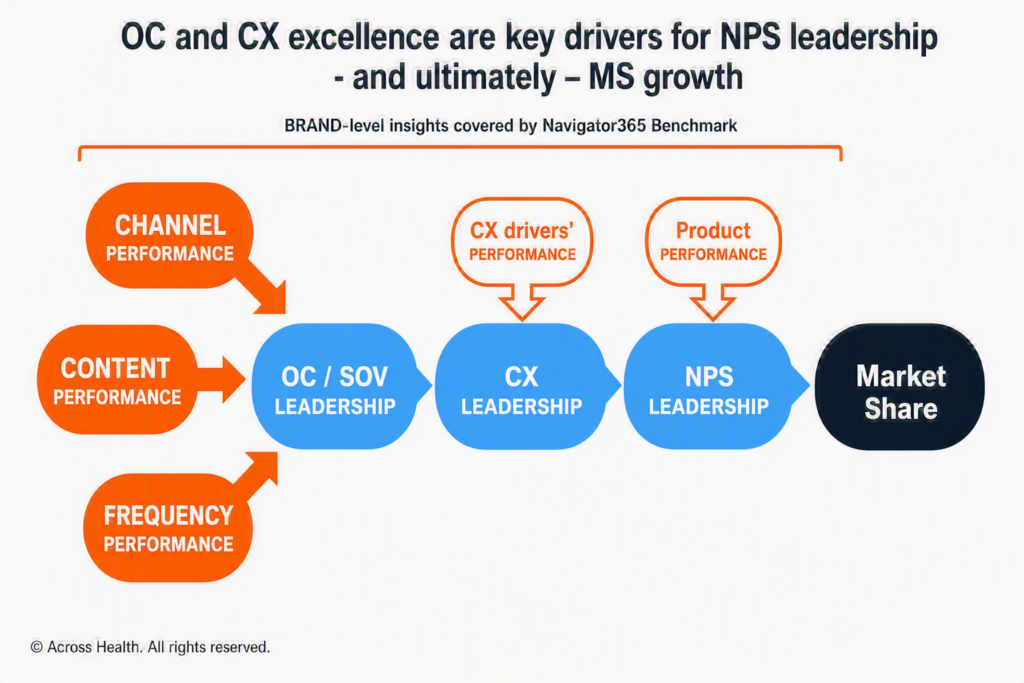
The analysis didn’t stop with perceptions. Using the Navigator365 Benchmark data and a hypothesis we have explored previously, we were able to demonstrate a strong correlation (r = 0.84) between omnichannel performance and customer experience. From there, the analysis revealed a clear chain: better CX was linked to higher NPS, and higher NPS aligned with stronger market share growth across the two countries.
This validated what many marketers already suspect but often struggle to quantify – that customer experience is not just a “soft” metric, but a commercial driver that influences loyalty, advocacy, and ultimately, prescribing behaviour.
A framework for smarter decisions
The analysis helped identify clear priorities to improve performance in Germany:
- Rethink the go-to-market approach
- Leverage high-impact digital channels to increase frequency and reach
- Address key CX drivers such as ease-of-engagement and responsiveness to HCP requests
- Address key content drivers such as improving ‘relevance to daily practice’ and ‘content clarity and conciseness’
Perhaps most importantly, it gave the client team a repeatable framework they could apply across other markets to make more informed strategic decisions.
Navigator365 Benchmark 4D is a brand-level competitive diagnostic that connects omnichannel execution, customer experience, brand attributes, and adoption dynamics across the competitors that matter most. If you would like to learn how these uniquely actionable insights can help shape your customer engagement strategy, book a call with one of our experts.