In today's fast-paced market, understanding where your business stands compared to the competition is crucial. Competitive customer experience (Cx) benchmarking is an essential tool for businesses aiming to enhance their omnichannel engagement and overall customer satisfaction. In a recent collaboration with a client, we set out to test a hypothesis that Cx benchmarking could set your company on a path to improved business outcomes.
We wanted to see if we could leverage data from our Navigator365™ Cx Benchmark to demonstrate the following correlation:
 The three charts below utilise both Cx Benchmark (n=301 specialists across 7 markets) and client-provided data to show that competitive benchmarking can indeed put you on track for improved omnichannel engagement and customer experience (Cx), with strong suggestions for links with improved business outcomes.
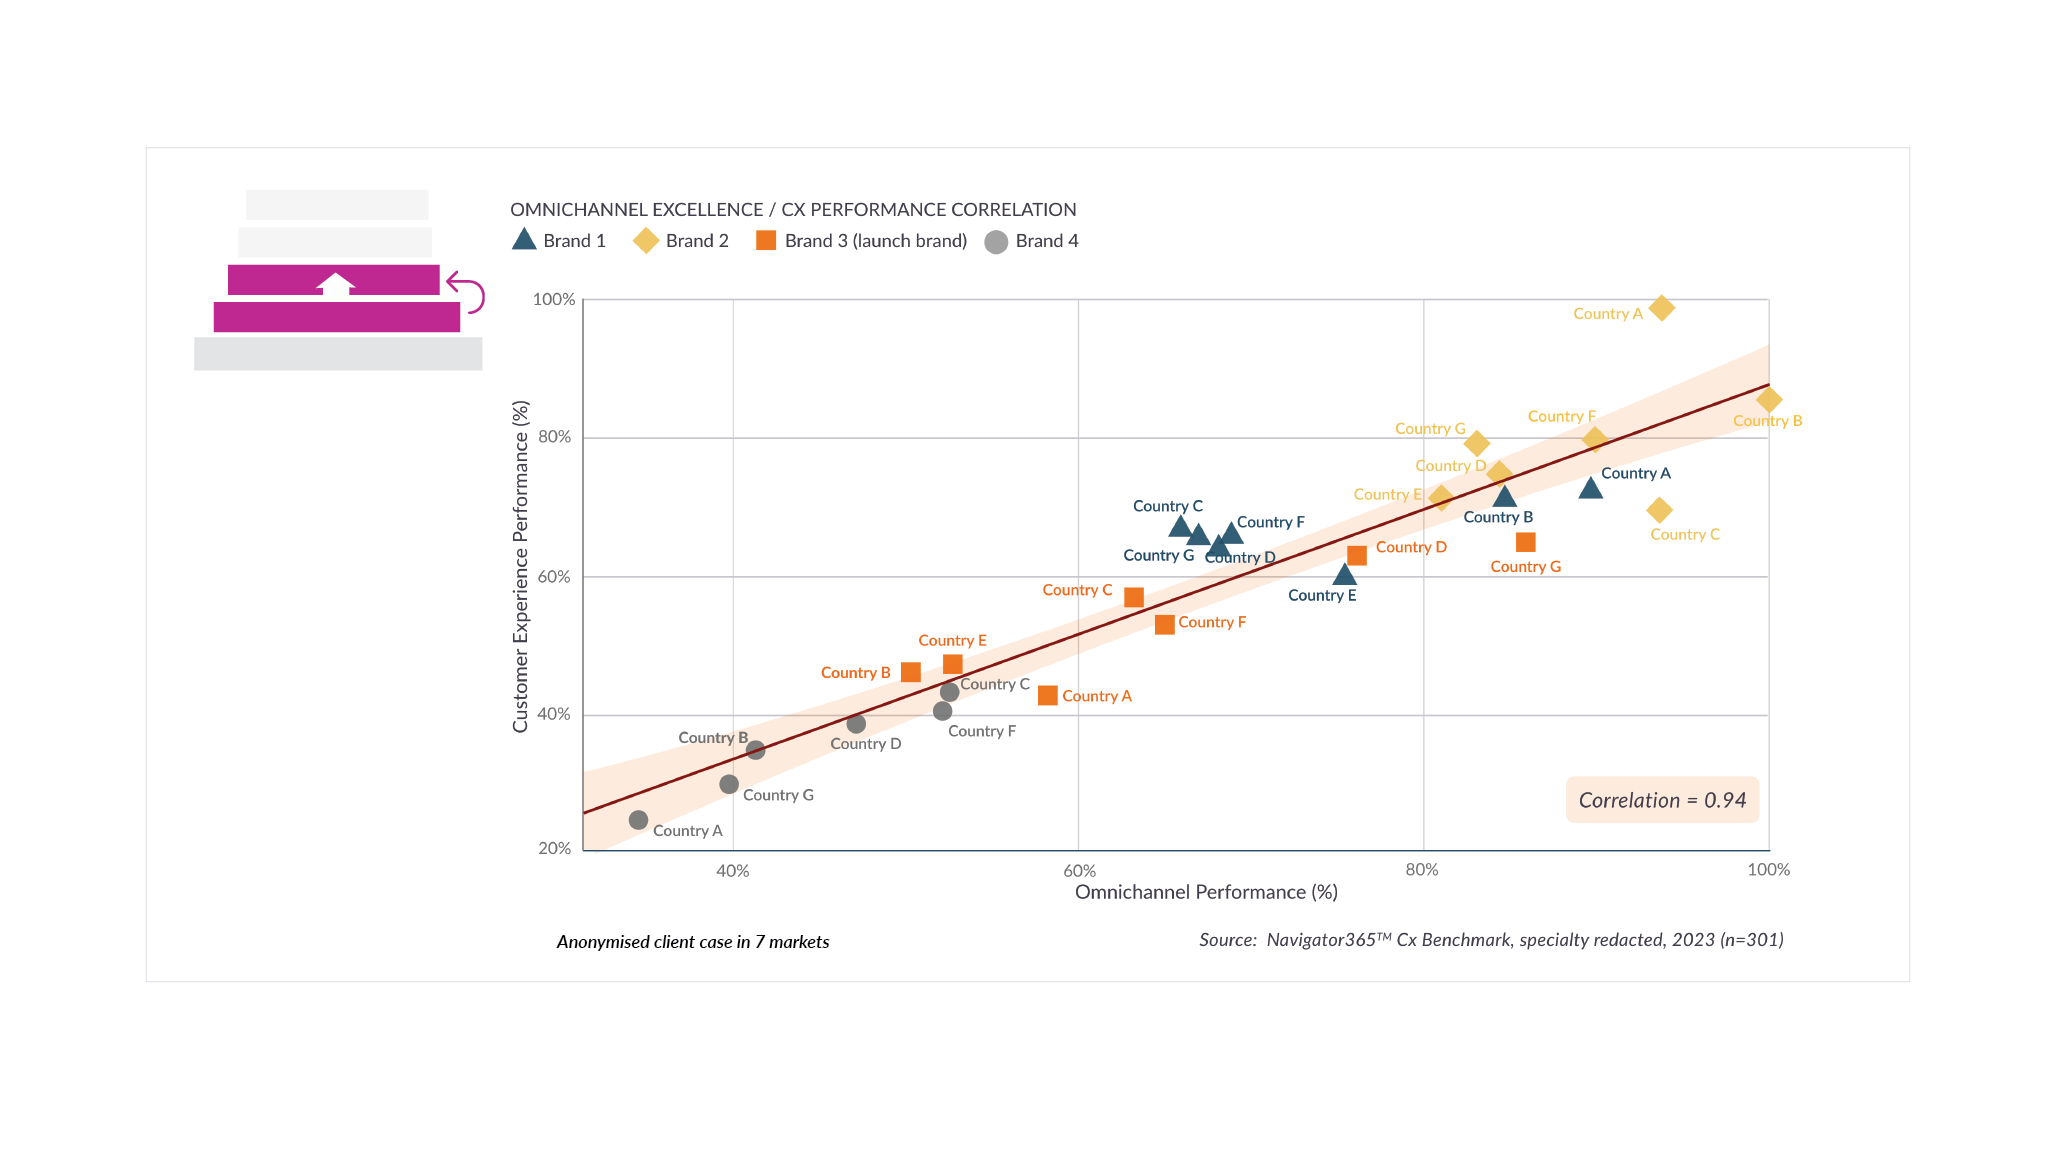
 Navigator365™ brand-level benchmarking data reveal a strong positive correlation between omnichannel engagement (X axis) and Cx performance scores (Y axis). These benchmarks provide a clear picture of where your business excels and where it might be lagging behind competitors, and companies that invest in seamless experiences across various channels and content consistently score higher in customer satisfaction metrics. By focusing on areas needing improvement, you can streamline your strategies to boost overall engagement and satisfaction.
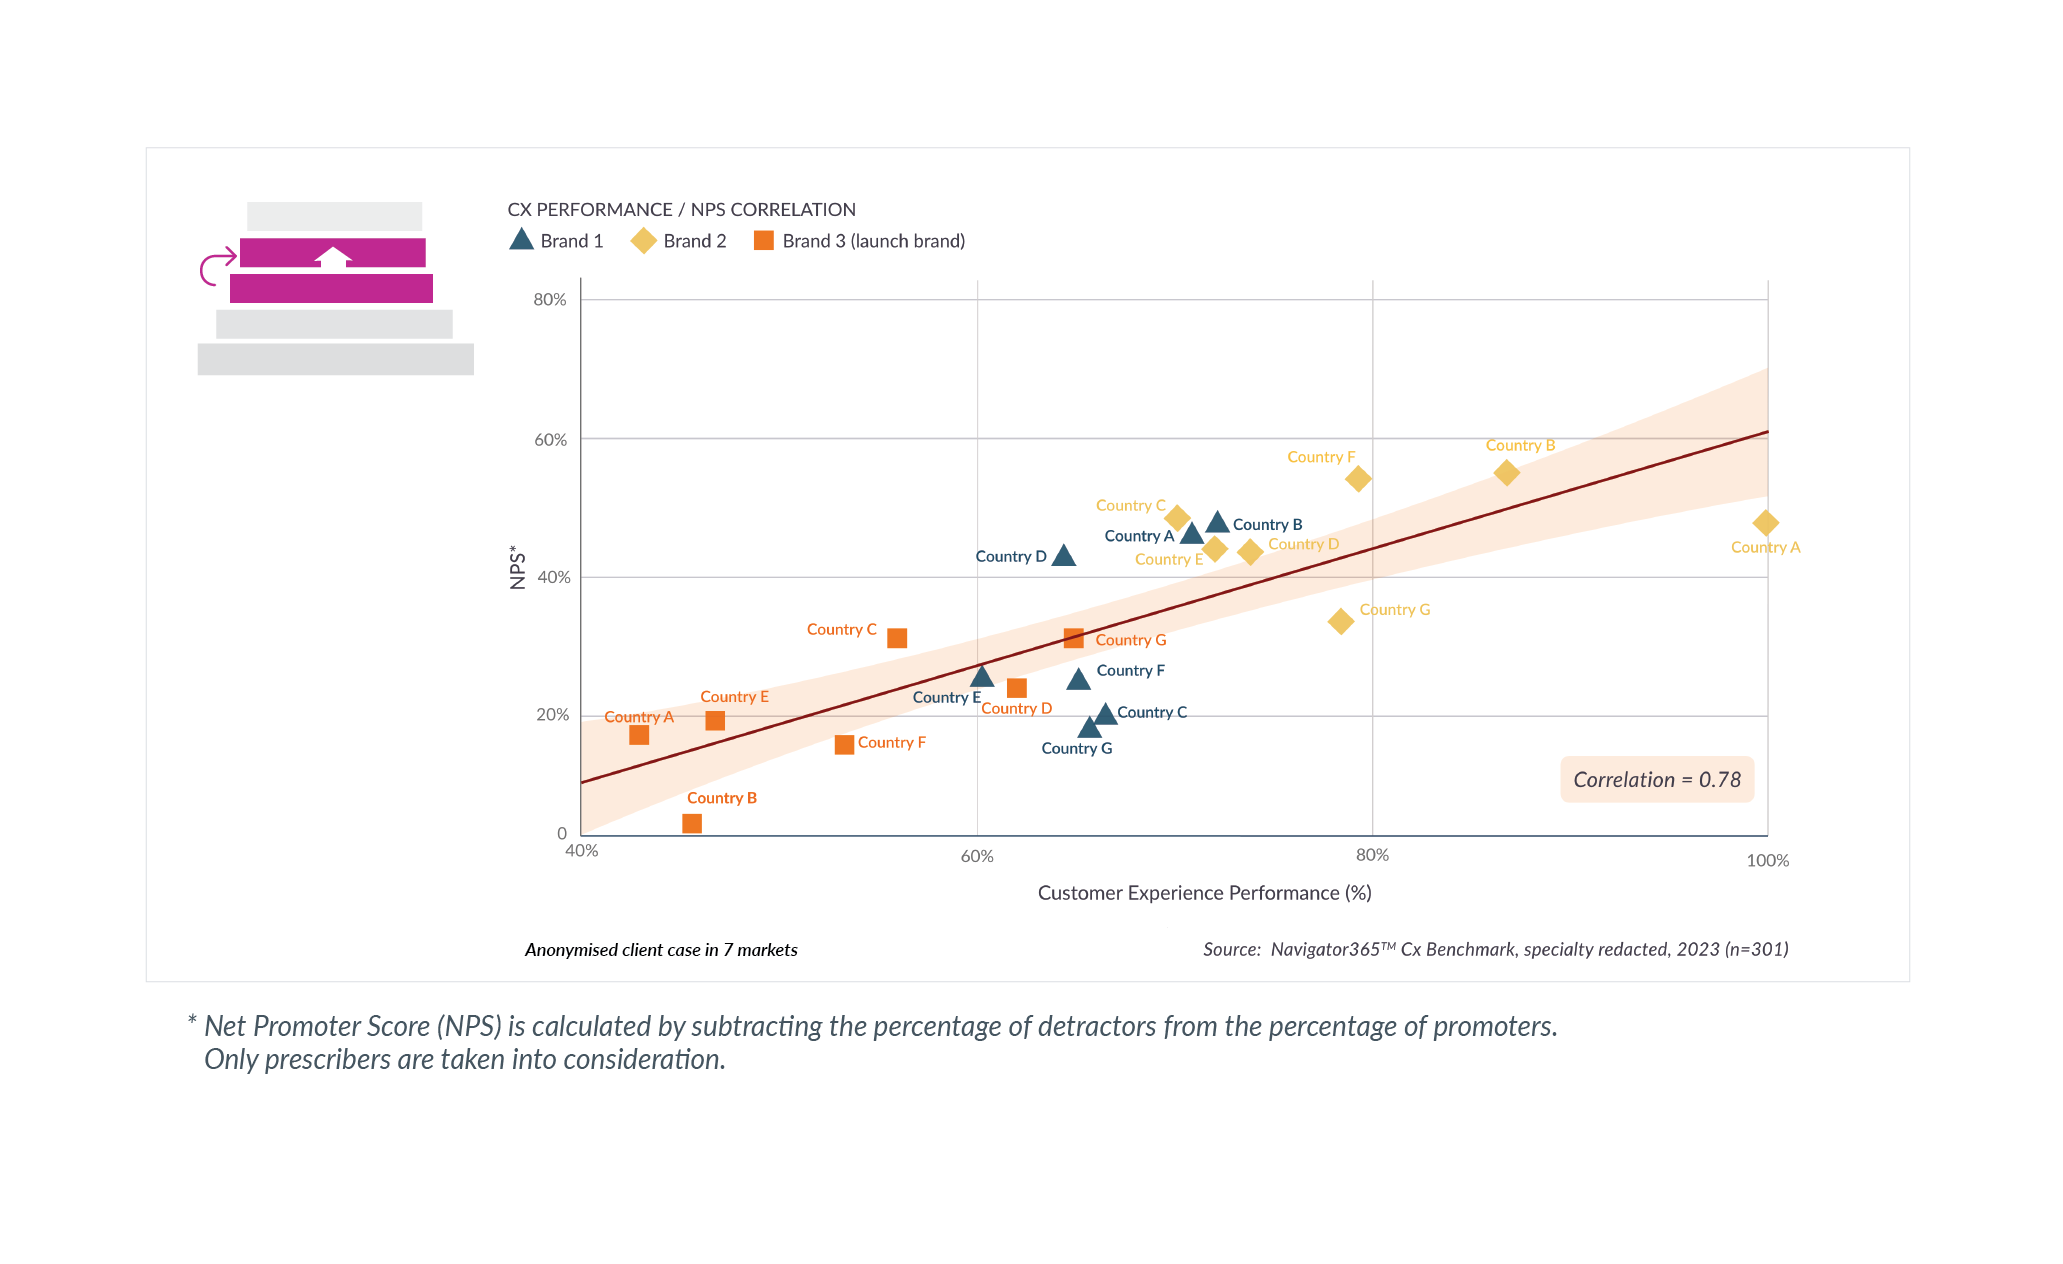
 We previously explored how brand-level Net Promoter Score (NPS) is a critical (and differentiating) metric for measuring customer loyalty and satisfaction. The data from Navigator365™ Cx Benchmark show that improvements in Cx (X axis) directly correlate with higher brand NPS (Y axis) . Of course, it makes sense that, by benchmarking your Cx against industry leaders, you can identify gaps and implement targeted actions to enhance the customer experience – and as your Cx improves, your NPS is likely to rise, reflecting a more satisfied and loyal customer base. But we don’t like to work off assumptions – everything we do is evidence-based!
 To complete the final link in the chain, we set out to test the claim that higher brand NPS implies not just loyal customers but also a superior revenue and/or market share evolution. Our client provided 12-month market share evolution data (Y axis) for three specialty brands (two growth brands and one recently launched product, shown in orange) across seven countries. We then plotted the brand NPS scores (adjusted for country-specific differences) taken from Navigator365™ Cx Benchmark (X axis). The chart reveals a compelling correlation between the two dimensions, particularly for the two growth brands.
Competitive Cx benchmarking is not just about understanding where you stand; it's about leveraging that insight to enhance omnichannel engagement, boost customer satisfaction, and ultimately drive better business outcomes. Navigator365™ brand-level benchmarking data reveal a strong positive correlation between omnichannel engagement and Cx performance. Cx is proven to have a substantial influence on NPS. And – as shown by coupling recent Cx Benchmark datasets with client-provided data – NPS is a key predictor of sales and market share evolution.
By regularly measuring and improving your customer experience, you position your business to outperform competitors and achieve sustainable growth. So stay ahead of the curve by making Cx benchmarking a cornerstone of your business strategy.
To learn more about how Navigator365™ Cx Benchmark can help you improve your brand’s omnichannel leadership & customer experience versus your direct competitors, click here.
Alternatively, we would be happy to arrange a call with one of our omnichannel experts to explain further how competitive benchmarking can help you take the right strategic channel and content optimization decisions.


