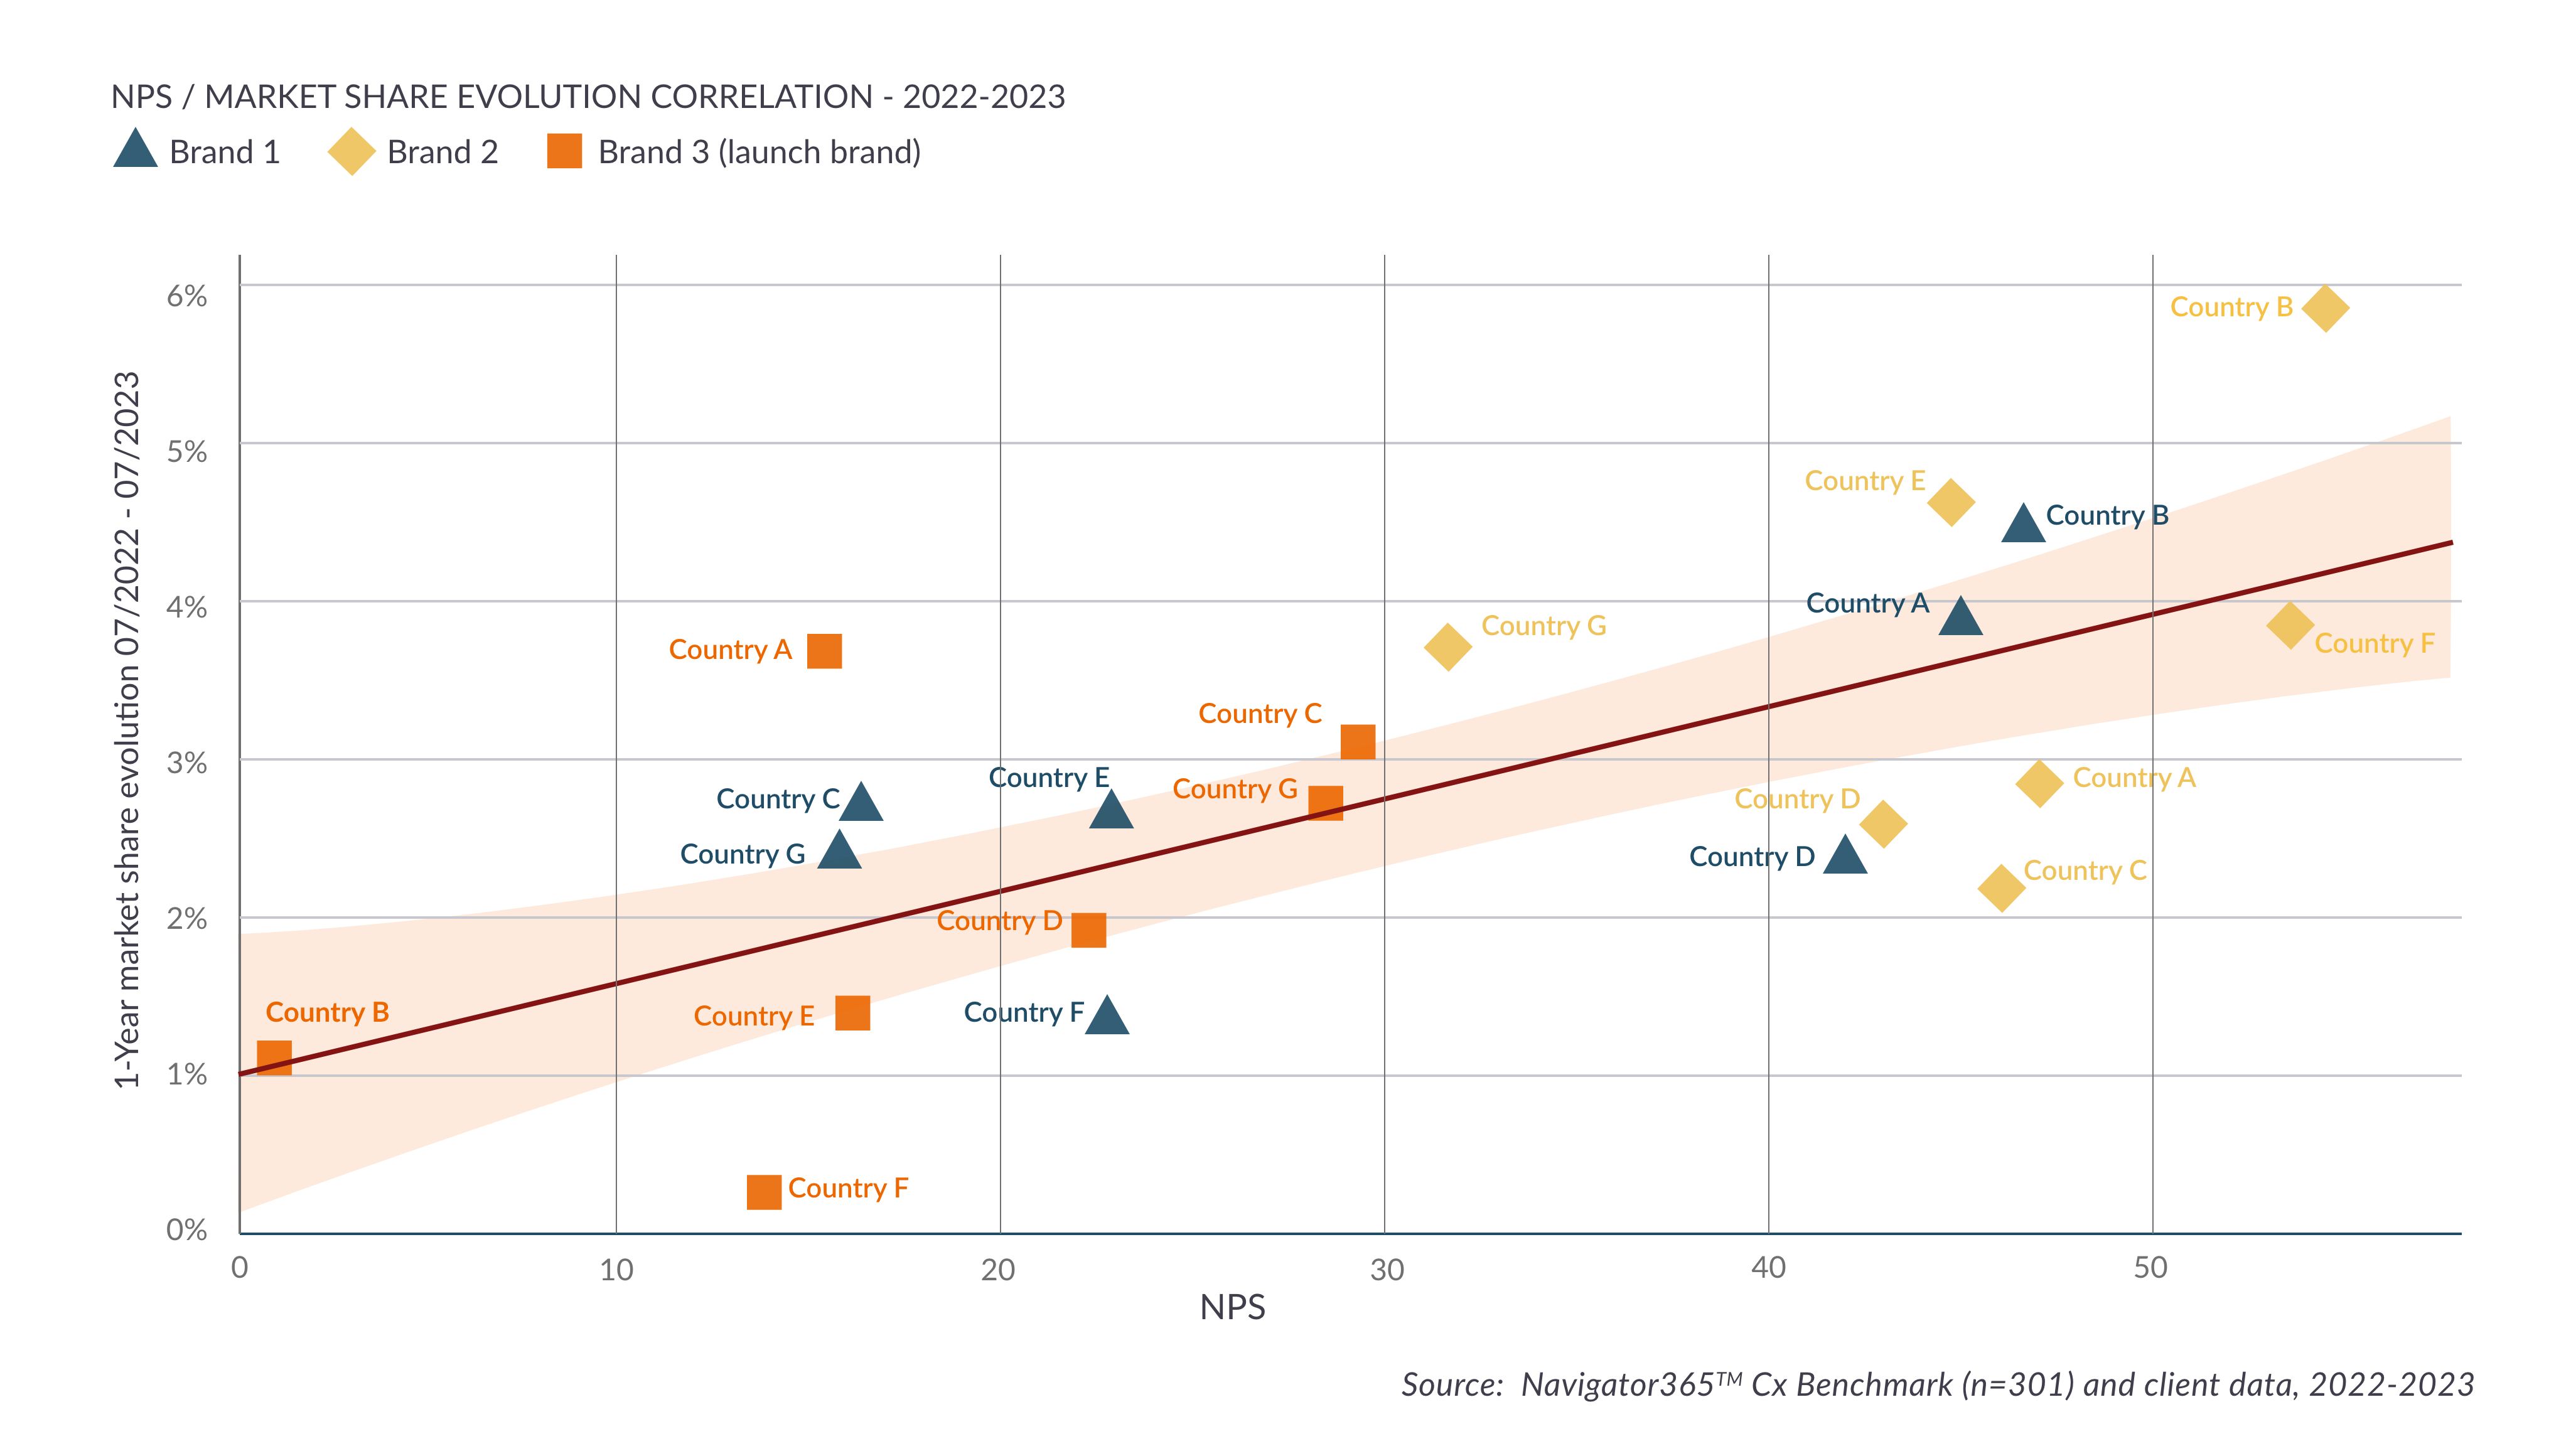
Chart of the Month – A higher NPS corresponds to increased market share
January 2024, our CHART of the MONTH:
In the pursuit of understanding and improving customer experience, one benchmarking KPI stands out as a popular indicator of success – the Net Promoter Score (NPS). Why is this metric so crucial? According to Fred Reichheld, the originator of the metric and author of “The Ultimate Question – Driving Good Profits and True Growth”, a higher NPS implies not just loyal customers but also a superior revenue and/or market share evolution, thanks to the double-whammy effect of loyalty and spontaneous product advocacy to peers (hence the “promoter” name for those respondents who award a rating of 9 or 10 out of 10).
We tested this hypothesis in a recent collaboration with a client, who provided 12-month market share evolution data (Y axis) for three specialty brands (two growth brands and one recently launched product, shown in orange) across seven countries. We then plotted the brand NPS scores from a 2023 Navigator365™ Cx Benchmark (X axis), adjusting for country-specific differences in NPS by subtracting the average NPS per country from the respective brand NPS.
The chart reveals a compelling correlation between the two dimensions, particularly for the two growth brands – for the recently launched brand, the pattern is less clear for certain markets, which may be due to the small number of promoters/loyal users in the early PLC stage (worth noting that in our Navigator365™ Cx Benchmark research we often see relatively low NPS numbers for launch brands).
Finally, as we previously demonstrated, promoter NPS ratings are largely driven by customer experience, rather than brand attributes. Investing in superior omnichannel customer experience should therefore be a strategic imperative.
For a more in-depth look at the case for NPS over other macro-levels KPIs (such as CES and CSAT) in tracking HCP customer experience and engagement, check out our long-read blogpost here.
If you would like to know more about how Navigator365™ offers uniquely actionable insights and tools to help you shape your customer engagement strategy and omnichannel planning, then please get in touch!
Chart of the Month is an ongoing series where we highlight an interesting chart or statistic from our Navigator365™ Core, Cx Benchmark and Maturometer™ research, and offer a brief commentary on what this can tell us about trends in customer engagement in the life sciences. Browse through our previous Charts of the Month here!


