
Chart of the Month - A month in the (omnichannel) life of a Spanish oncologist
July 2022, our CHART of the MONTH:
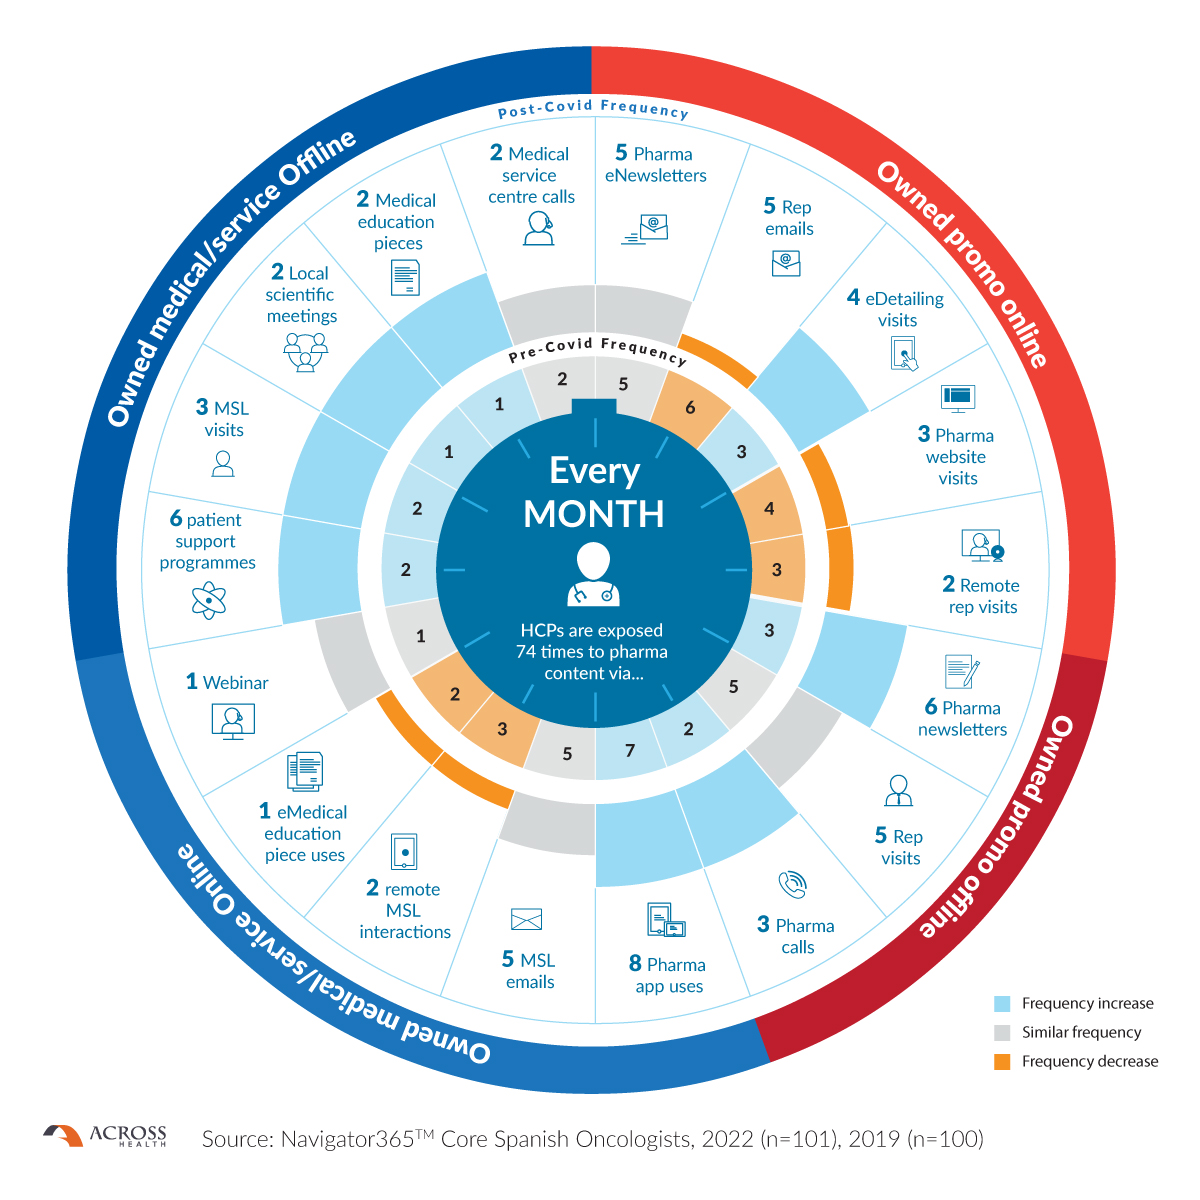
Just how often does the average HCP get exposed to pharma channels in the post-Covid world (2022)? And (how) does that differ from 2019?
Taking Spanish oncologists as an example, fresh Navigator365™ Core data shows that, each month, HCPs have over 70 interactions with pharma content through ‘owned’ channels – these are channels (medical and commercial) that a company has complete control over – both offline and online.
It’s important to note that, in isolation, these data give no indication of what the optimal channel mix is, or whether HCPs find them impactful, but they do help to illustrate what sort of channels are reaching the customer, and how often – and don’t forget that HCPs will be getting exposed to pharma content via paid and earned channels as well.
What’s interesting is that when we compare these latest data with the corresponding numbers from 2019 – just prior to the Covid pandemic – we see that of these eighteen pharma-owned channels (both medical and commercial), most (6/8) offline channels increased in frequency vs 2019, compared with only 2 out of 10 for the online channels. And as far as the “omnichannel rep” is concerned, rep email and remote detailing have dropped while F2F visits are on a par with 2019. Does this suggest we are getting back to the old normal? Is it another illustration of “skin hunger”? Or a stronger medical orientation of HCPs/pharma? OR is it pharma that wants to go back to the old normal – and not the customer?
At any rate, it’s clear that evidence-based customer-centric mix planning is a dynamic discipline – and the past is in no way a predictor of future success.
If you would like to know more about how Navigator365™ can offer uniquely actionable insights to help you optimize your channel mix, then please get in touch!
Chart of the Month is an ongoing series where we highlight an interesting chart or statistic from our Navigator365™ Core research, and offer a brief commentary on what this can tell us about trends in customer engagement in the life sciences.